
Technical analysis

We heard mostly about this term in stock market trading. Analysis
of stocks is important while investing in stock market. When we start actual
trading we know day by day new terms like fundamental analysis, technical
analysis etc. here we will discuss about basics of technical analysis. As we
know this term is new point to many of us new traders and even they don’t know
basics information about technical analysis. So guys let’s take basic
information about technical analysis.
What is Technical Analysis?
We should know what is Technical Analysis? So technical
analysis is art or science of predict future prices based on analyze of the
historical price movements of individual stock or Index. It is not astrology
for predicting prices of specific stock or index. It is based on examine
current demand-supply of commodities, stocks, indices, futures or any tradable
instrument. Some elements are important in technical analysis Like stock chart
pattern, price, volume, open interest (OI) etc.
The term "technical analysis" might sound a
little, well technical, but it's actually pretty simple. Essentially, it's a
strategy an investor may use to examine an investments stocks chart and attempt
to forecast its future performance. Some investors may use technical analysis
to attempt to identify when to enter or exit a stock position of their trade.
When performing technical analysis, investors can use a
variety of techniques and tools to analyze a chart. In this article, we will
focus on a few technical analysis basics including trend, support and
resistance, price patterns, and technical indicators. Let's start with the
first technique, trend.
What is trend?
 |
| tread zones |
There are three kinds of trends
Up trend
 |
| Up trend |
Down trend
Which is a series of lower highs and lower lows and here
situation is apposite of uptrend the price movement is down side that’s why we
assume it is down trend.
Sideways trend
 |
| sideways trend |
This has roughly equal highs and lows. This trend occurs after a trend where price moves sideways between support and resistance. This consolidate situation create because of profit booking of big traders.
Some investors determine a stock's trend by identifying the
direction of its highs and lows. Trend may be important because many investors
believe that a stock will generally continue in the same direction it's been
going. These investors would anticipate a stock with a strong uptrend to
continue to rise, while one with a strong downtrend will continue to fall. Some
investors draw lines to attempt to identify the trend. Investors can also draw
lines to connect highs and lows. These lines are known as support and
resistance levels. The next technique we will discuss here is support and
resistance.
What is support? What is resistance?
Support and resistance are price levels that the stock has
had trouble breaking through. If a stock breaks through support or resistance,
it could be a signal to enter or exit. For example,
Suppose a stock breaks through resistance, which is the level
it repeatedly pulled back from in the past. Because it broke through
resistance, an investor may believe that there's a good chance that the stock
will continue to raise so broken resistance may be a good time to enter. On the
other hand, if the stock fell near past a support area, it may continue to
fall. This could be considered a good time to exit.
Price pattern
After connecting support and resistance levels, a stock's
price movement may resemble a certain shape. These shapes are called price
patterns and are another technical analysis technique. Price patterns can build
on support and resistance, allowing investors to attempt to predict more
specific movements and try to point out even more precise entry and exit
signals. There are many different price patterns.
Some examples include simple shapes like triangles or flags and
more complex patterns like head and shoulders or triple tops, double tops etc.
Let's look at an example.
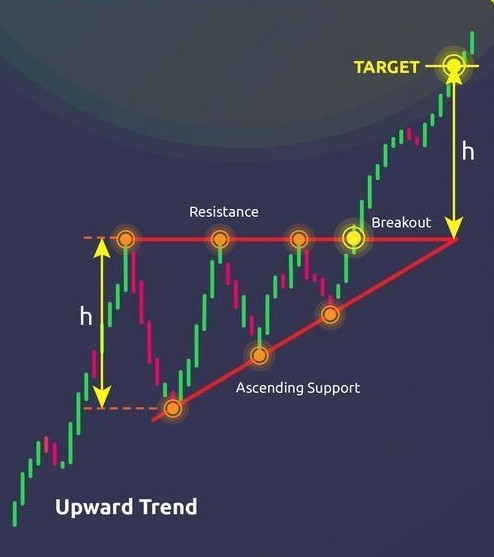
Add image
This is called an ascending triangle, and it forms when a
stock's highs are hitting resistance while its lows are steadily rising. Some
investors might interpret the narrowing between the highs and lows as a signal that
the stock's about to break through resistance. If it does, the stock's price is
expected to rise in value right after the breakout.
Technical indicators
Sometimes all investors not exclusively use support and
resistance and price patterns. Drawing lines and finding shapes can be
subjective. Because of this, some investors may use technical indicators. Technical
indicators are graphical representations of chart data. Each indicator displays
chart data, like price and volume, in a unique way, giving investors another
perspective of the stock's performance. Because technical indicators are
created using formulas and data, they may give investors a more objective way
to examine a stock's performance.
Moving Average
A common technical indicator is a moving average line. This
indicator primarily use for identify trend of stocks or indices. Moving average
indicator averages the stock's price over a period of time and plots it as a
line, which can help determine the overall trend. Moving averages can be
calculated for any period of time, but one of the most common is 50 days.
In simple word moving average reflect the closing price of
market over specific number of periods of number of candles.
So what does a moving average tell you about an investment?
Imagine a stock's price crosses above its 50-day moving average.
This may indicate that the stock is outperforming its recent history. This
could be an entry signal. Similarly, if the stock begins to fall and dips below
its moving average, it could be an exit signal.
Moving average lines are only one of many technical
indicators investors may use. Other common indicators include price envelopes, Bollinger
bands, stochastic oscillators, and the relative strength index.
At the end of point, we've covered some basics of technical
analysis. One thing to keep in mind is that technical analysis can help you
identify potential entry and exit signals, but it offers no guarantee of
success. After all, there is no way to predict the future. We've only covered
the tip of the technical analysis iceberg and all this knowledge is educational
purpose.
Learning how to use the techniques and tools we've discussed,
as well as the many others out there, can advance your technical analysis
skills.
